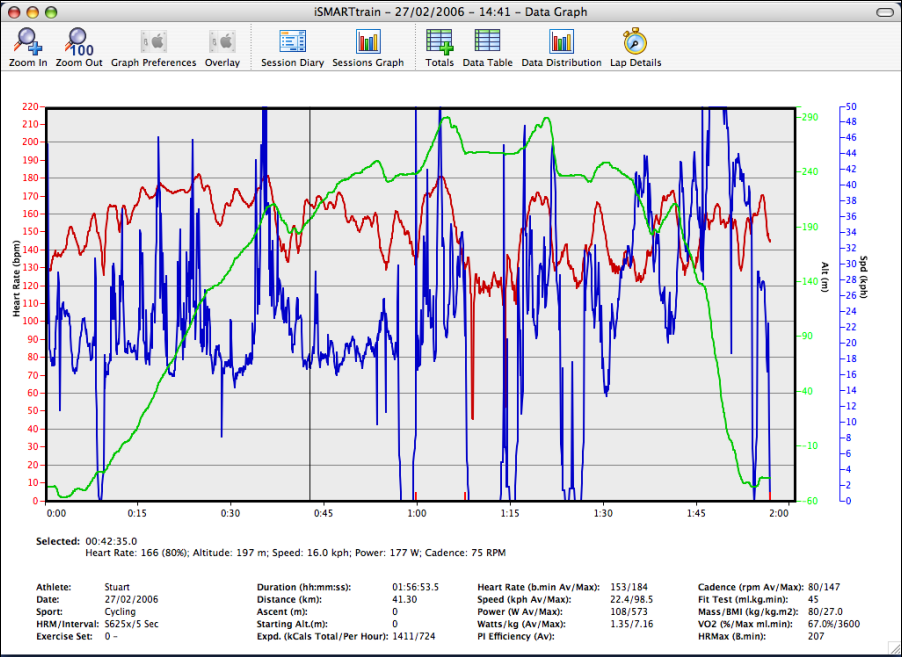
Heart Rate/Speed/Altitude Graph
The HR Graph window shows the downloaded data from your HRM in graphical form. It can show Heart Rate, Speed, Altitude, Cadence, Power, LR Balance and Pedal Index. The data shown can be switched on and off to show only the items you're interested in. The Area below the graph shows a summary of the data, and provides information such as your BMI and VO2 Max statistics.
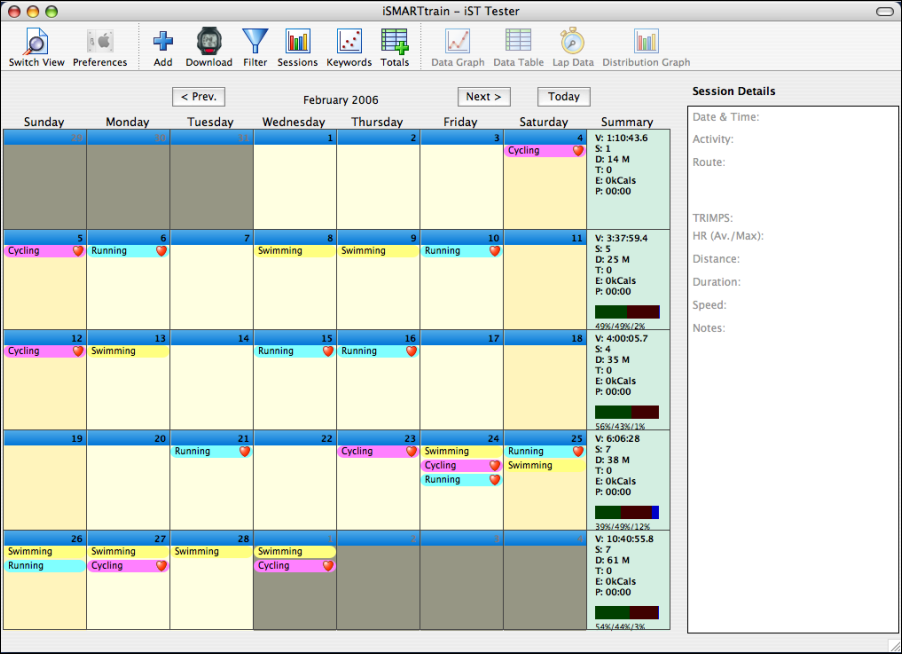
Sessions Calendar
The Sessions Calendar displays your training sessions as a monthly calendar. The details of each session can be displayed simply be clicking on it.
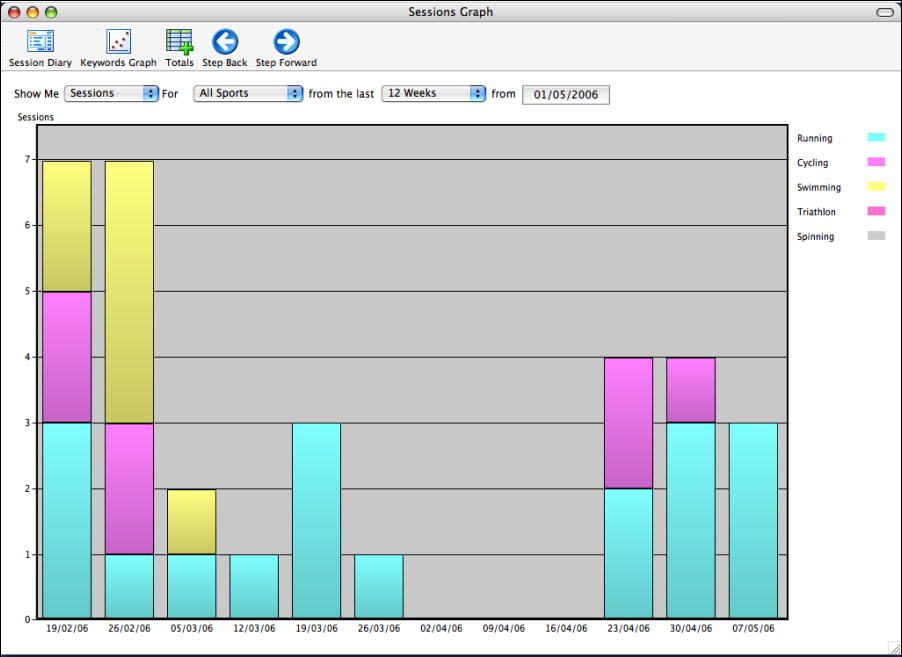
Sessions Graph
The Sessions graph shows your sessions in bar graph form. Each bar represents the number of sessions, the distance covered or the time spent training for each week or month of the period covered.
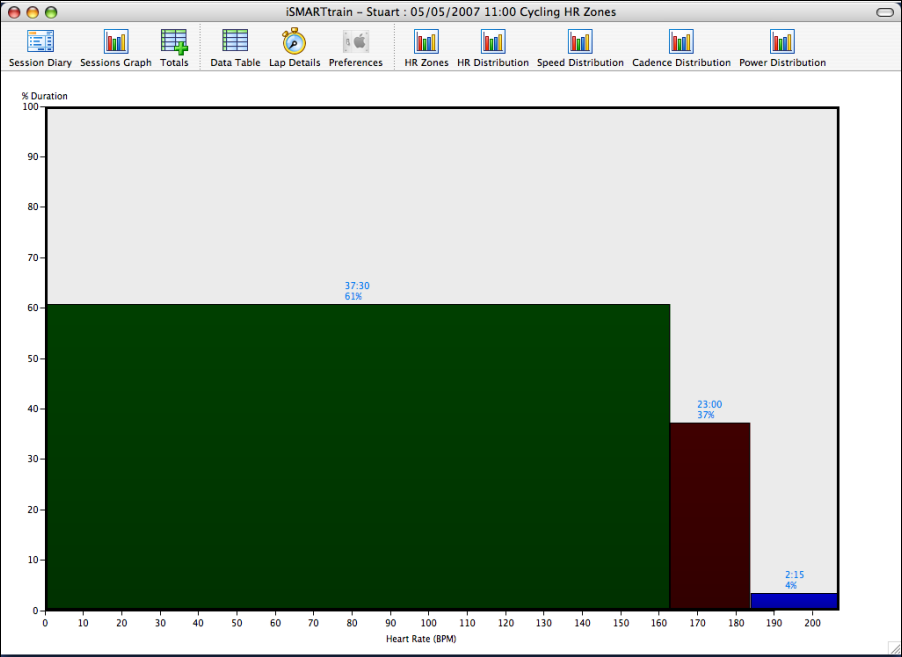
Distribution Graph
The HR Zones graph shows the amount of time spent in each heart rate 'zone'. The upper and lower limits of each zone are defined in the User Preferences. Up to 5 zones can be used. Each bar represents the total time that your heart rate has spent between the two limits.
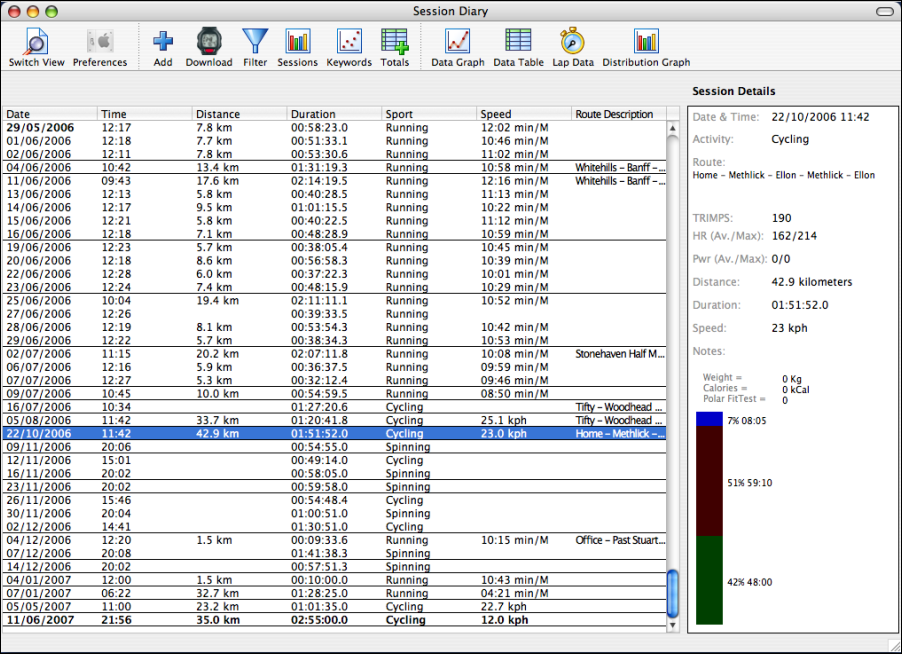
Sessions Window
The Sessions window shows your training sessions as a list. Each set of sessions is ruled off into a week, as defined in the user preferences.
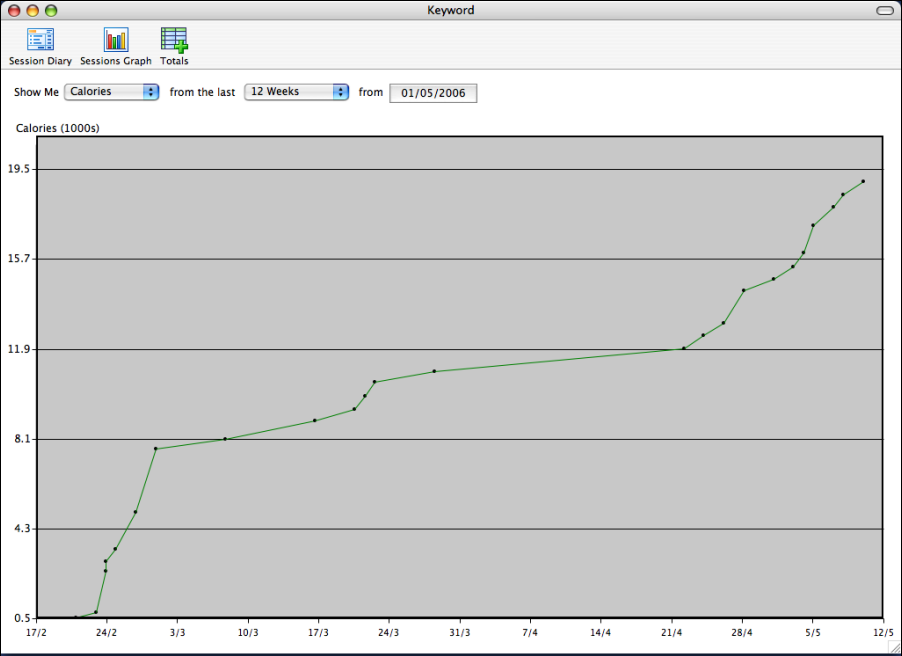
Keyword Graph
The Keyword Graph window shows you to graph the user-defined keyword in your log file. The keywords can show any integer value, and can be display as either an absolute value (e.g. weight) or a cumulative value (e.g. Calories burned). Each keyword can be linked to an HRM feature, such as total ascent or calories burned.
The Period of the graph can be selected from a menu, and you can select end date of the data.